Pro
€10
/ month
- Up to 10 users
- 10,000 comments / month
- Writable comments column
Glyph Company Presents
for Power BI
PowerBI reports are read-only. This visual changes that.
60 days · no card
Simple Comments · Table visual
| Order | Region | Amount | Comment |
|---|---|---|---|
| 1842 | EMEA | €12,400 | Ship by Friday. |
| 1901 | APAC | €4,210 | ▍ |
| 1766 | NAM | €31,050 | Leave a note… |
| 1688 | EMEA | €8,920 | Leave a note… |
The missing piece
The Simple Comments visual acts like the standard table visual but with an extra editable column.
The column is synced in real time to a secure database, only accessible with your license key.
No other data is ever stored by us, except that column.
In the report
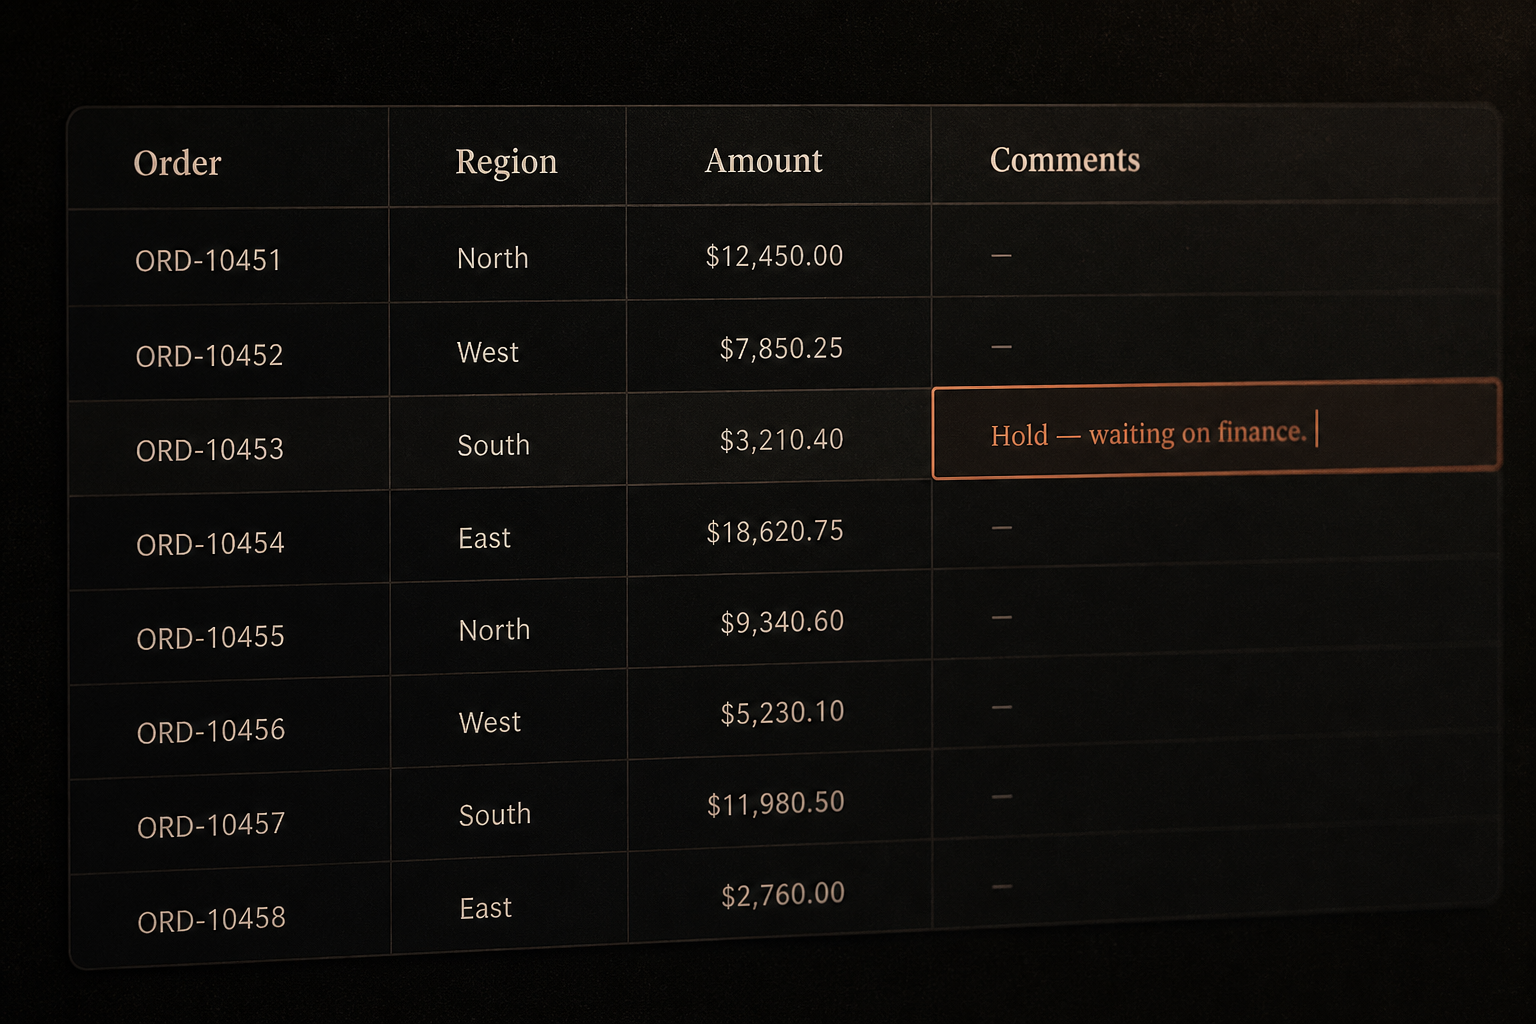
Click a cell and type. Press Shift+Enter to start a new line, so longer notes stay readable inside the row. Every change is saved as you type.
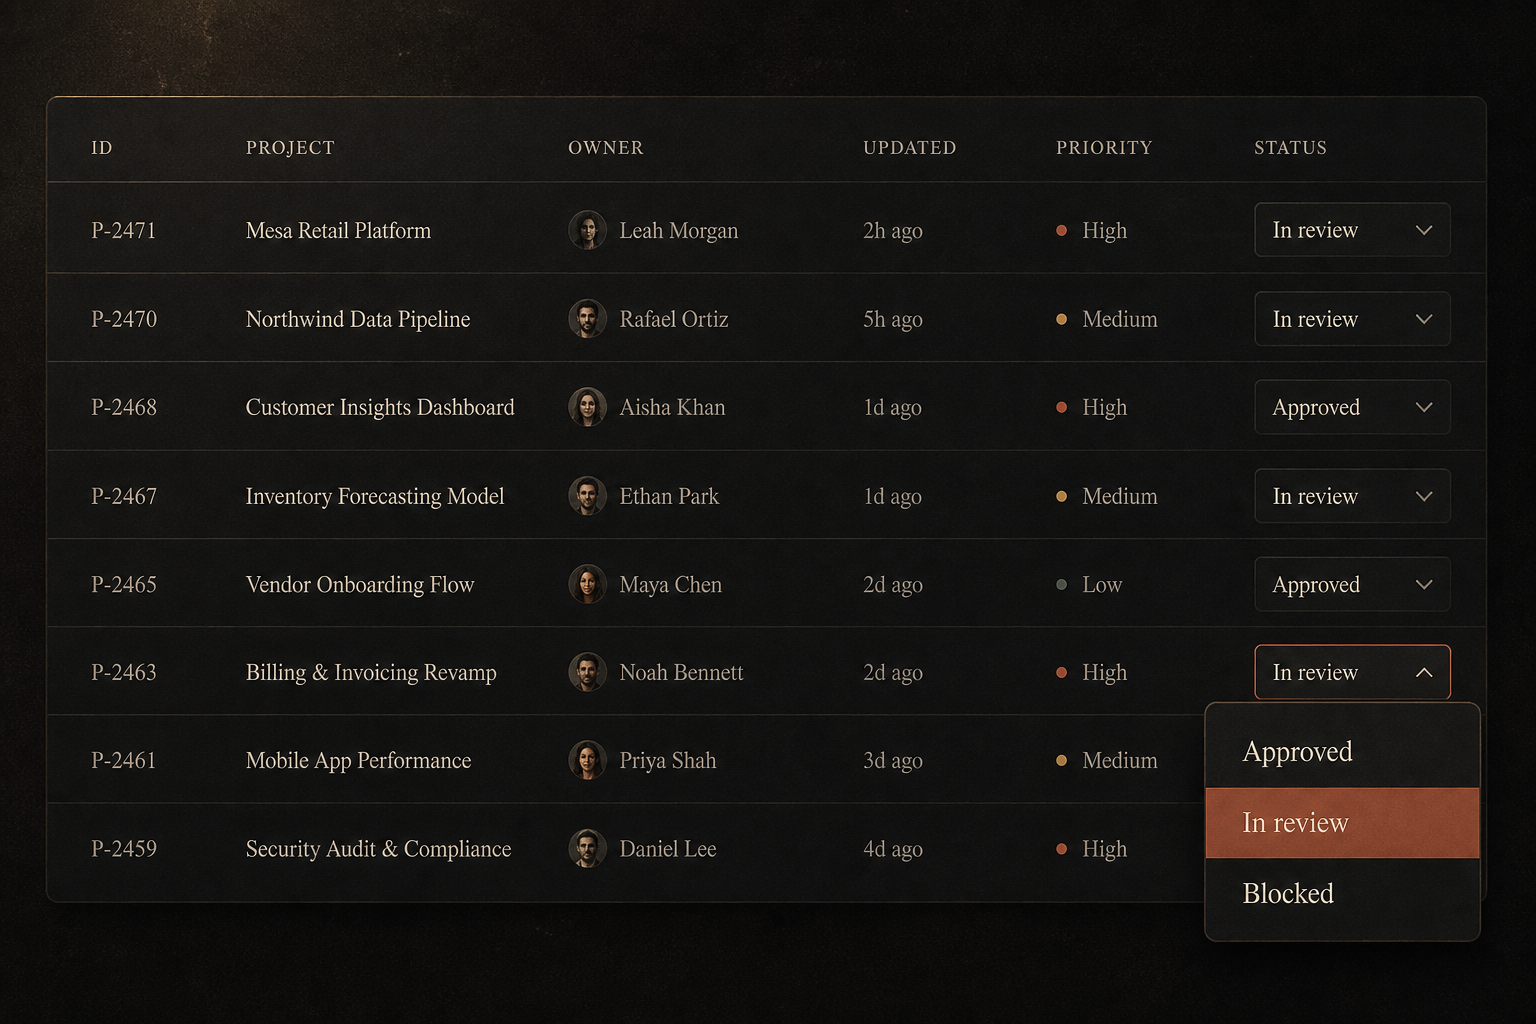
Turn a column into a dropdown with your own list of values, such as Initiated, In progress, Blocked and Finalized. Give each value its own text and background color, so blocked deals stand out at a glance.
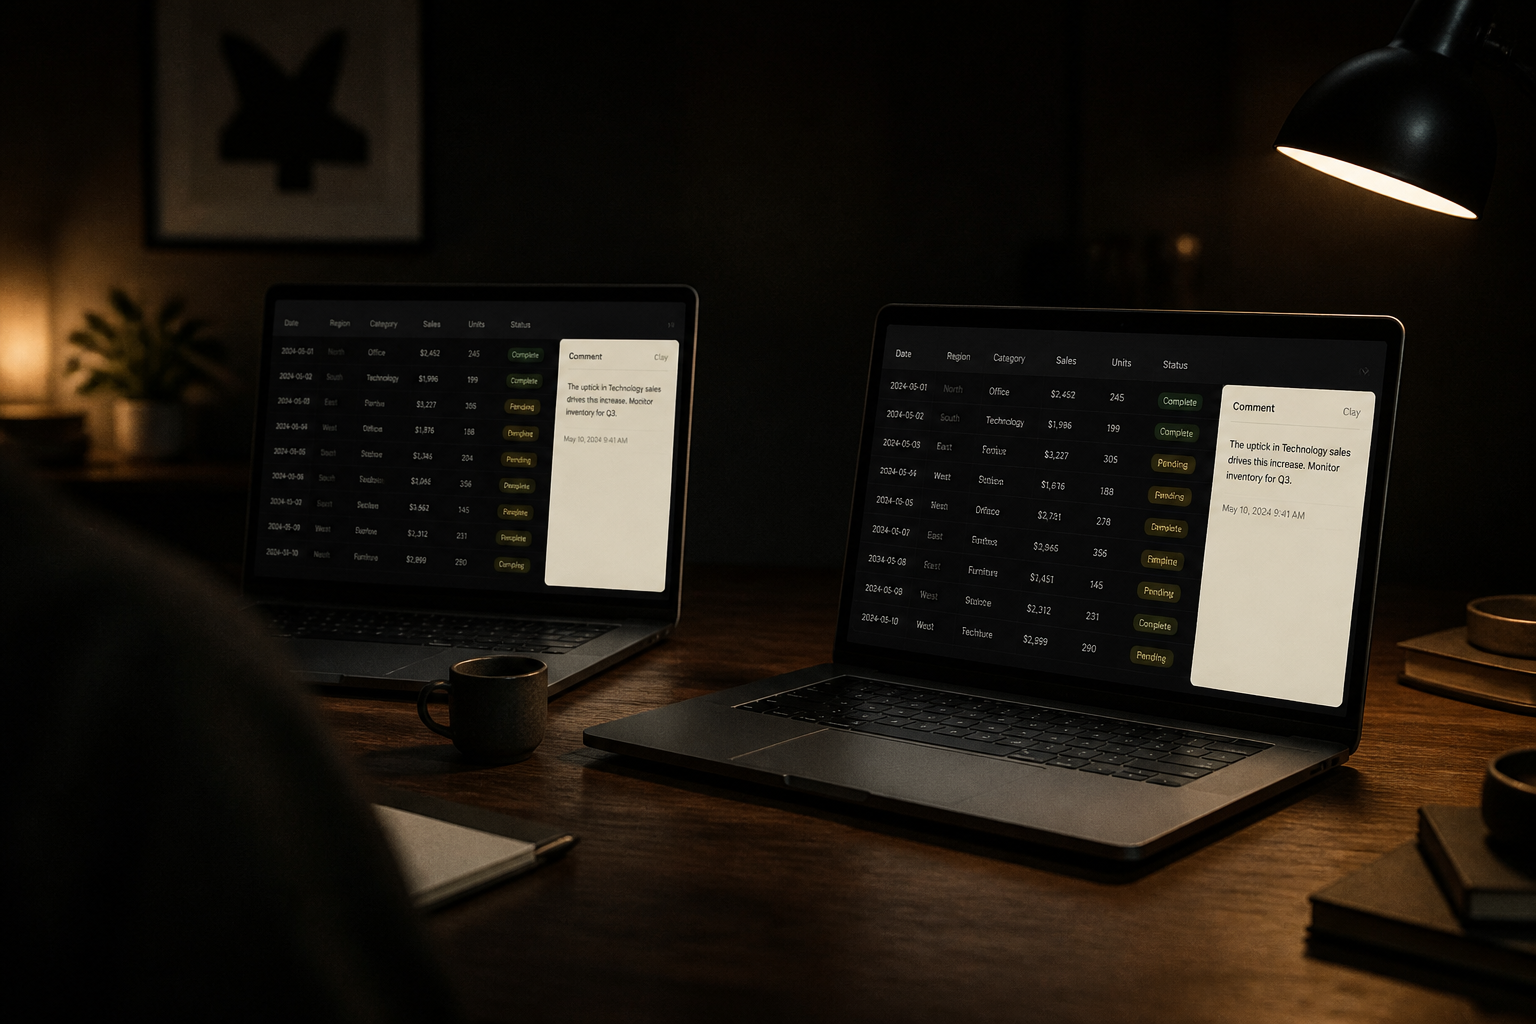
Add a measure to the Security field. Rows where it returns TRUE can be edited, and every other row is read-only. Use it to limit editing to certain people or to lock past months.
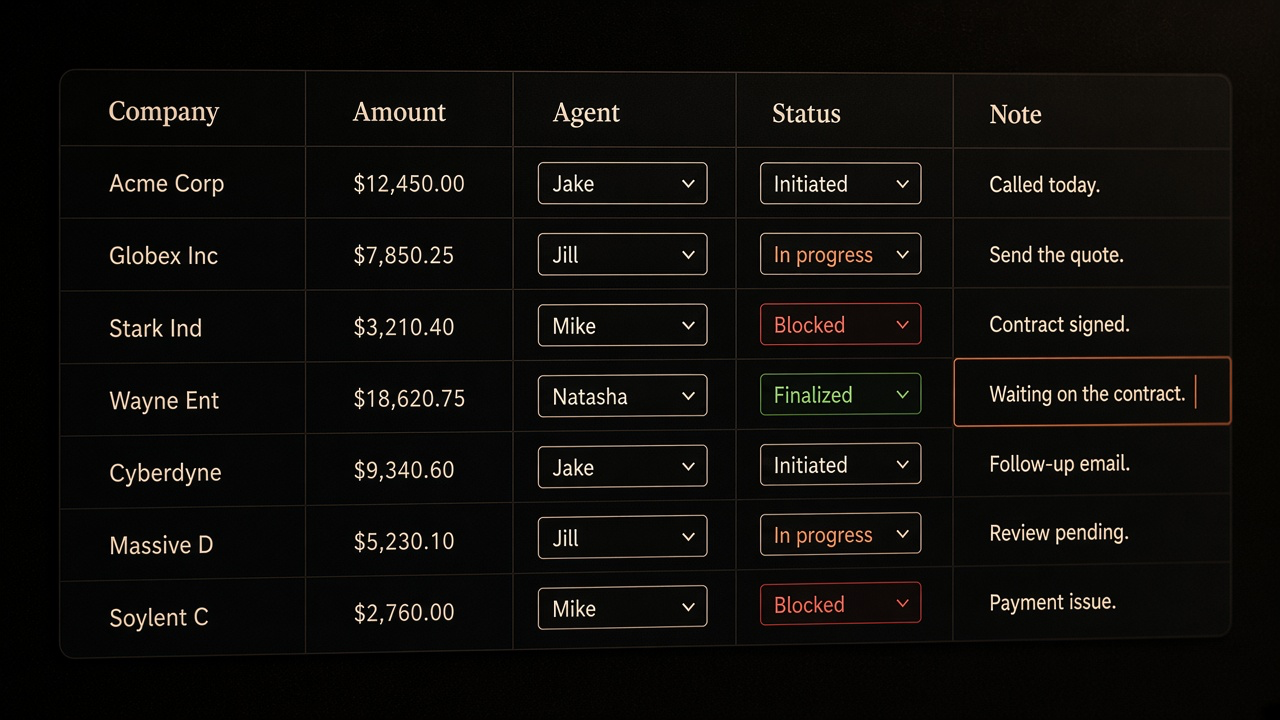
One visual can hold up to five editable columns, each with its own name, format and input type. Track an owner, a status and a note side by side on the same row. Available on Premium.
How it works
Activate a free trial. Your license key appears on the dashboard.
Add Simple Comments to your report. Under Format → Config, paste the key and set how many comment columns you need.
Drag the fields you want to show into Display, just like a regular table.
Drag the fields that identify a row into Context, such as Company and Month. Each unique combination gets its own editable cells.
Click a cell and type. The value saves right away, and everyone using the same key sees it.
Full setup walkthrough
Pricing
Paid licenses are billed annually.
€10
/ month
€50
/ month
Custom
Pricing
Try every Premium feature free for 60 days, no card required. Setup takes a few minutes, and your team can start editing today.
Activate Your Free Trial